


Electricity marketforecasts
Forecasts of system demand, renewable generation and the day-ahead price (PTF). Model performance is measured daily against EPİAŞ Transparency data and reported.
- Demandawaiting measurement
- Wind – Licensedawaiting measurement
- Wind – Unlicensedawaiting measurement
- Solar – Licensedawaiting measurement
- Solar – Unlicensedawaiting measurement
- Hydroawaiting measurement
- PTFawaiting measurement
Our areas of work.
Forecast products are offered by subscription; optimisation and software work is planned as a project around the organisation's needs.
- Demand
- PTF
- Wind
- Solar
- Hydro
Hourly forecasts of system demand, the day-ahead market clearing price, and wind, solar and hydro generation. Day-ahead forecasts are published every morning; intraday products are being prepared to update throughout the market sessions. Accuracy is measured daily against EPİAŞ Transparency data.
- Demand
- PTF
- Wind
- Solar
- Hydro
Plant-specific hourly generation forecasts for solar, wind and hydro plants, to improve the accuracy of production schedule (KGÜP) submissions and to monitor imbalance cost. Actual generation is taken from EPİAŞ for licensed plants and from the organisation for unlicensed plants.
- Solar
- Wind
- Hydro
- KGÜP
Hourly consumption forecasts at distribution-zone and substation level, or for a single site. Modelled on the organisation's meter and operational data to support supply planning, capacity management and lower imbalance cost.
- Zone
- Substation
- Site
A forecast-based decision layer for portfolios made up of generation, consumption and bilateral contracts: day-ahead and intraday bidding strategy, position management and control of imbalance risk.
- Bidding strategy
- Position
- Imbalance risk
Operational planning under grid constraints for local grids and organised industrial zones with distributed generation, storage and flexible loads; improving capacity utilisation and losses together.
- Distributed generation
- Flexible load
- Industrial zones
Charge–discharge schedules based on price and generation forecasts for storage facilities and co-located batteries. Arbitrage, capacity and ancillary service revenues are assessed together with battery lifetime constraints.
- Charge–discharge
- Arbitrage
- Ancillary services
Not an off-the-shelf product: monitoring, automation and decision-support software developed specifically for your organisation's plant, grid, site or trading processes. From data collection and SCADA/meter integration to reporting and automated workflows, it is designed and deployed to work alongside your existing systems.
- Monitoring
- Automation
- Integration
- Reporting
Forecast products
For seven products: an hourly forecast-versus-actual comparison of the last 3 days up to yesterday, with the measured error; for solar and wind the error is expressed relative to installed capacity.
Accuracy measurement.
Daily error for the last 30 days, the period average and the best and worst day; measured against EPİAŞ actuals.
- WAPE for demand, price and hydro
- Weighted absolute percentage error: deviations in low-consumption hours do not overshadow the high-consumption hours. It is a widely used metric in energy markets; lower is better.
- The measurement window is stated
- Each value is shown with the number of hours and the date range it was measured over; a metric is never published on its own.
- Installed-capacity error for solar and wind
- Mean absolute error is expressed relative to the product's national installed capacity; every hour of the day is measured. Installed capacity is updated monthly from EPDK and EPİAŞ data.
- Actuals come from EPİAŞ
- The comparison is made against the official actuals of the EPİAŞ Transparency Platform.
The daily forecasting process.
Data collection, modelling, publication, access and next-day verification; the same sequence runs for every product and plant.
- Early morning
Data collection
Actual demand and generation and KGÜP/UEVM submissions from the EPİAŞ Transparency Platform; hourly temperature, irradiance and wind forecasts from Open-Meteo; calendar and public holiday information.
- Before publication
Modelling
Gradient boosting models trained separately for each product produce the 24 hours of the next day. The models are retrained regularly on current data and tested on historical data.
- 10:15
Publication
Next-day forecasts are published in the dashboard; the daily email report is sent at the same time. Plant-level forecasts are part of the same publication, as a separate series per plant.
- Throughout the day
Access
CSV export; automatic transfer to ETRM systems, Excel or in-house models with an API key. Web, mobile and integrations use the same data contract.
- Next day
Verification
As actuals arrive from EPİAŞ, the deviation of each hour and the WAPE of the day are calculated; the result is published in the dashboard and in the accuracy history.
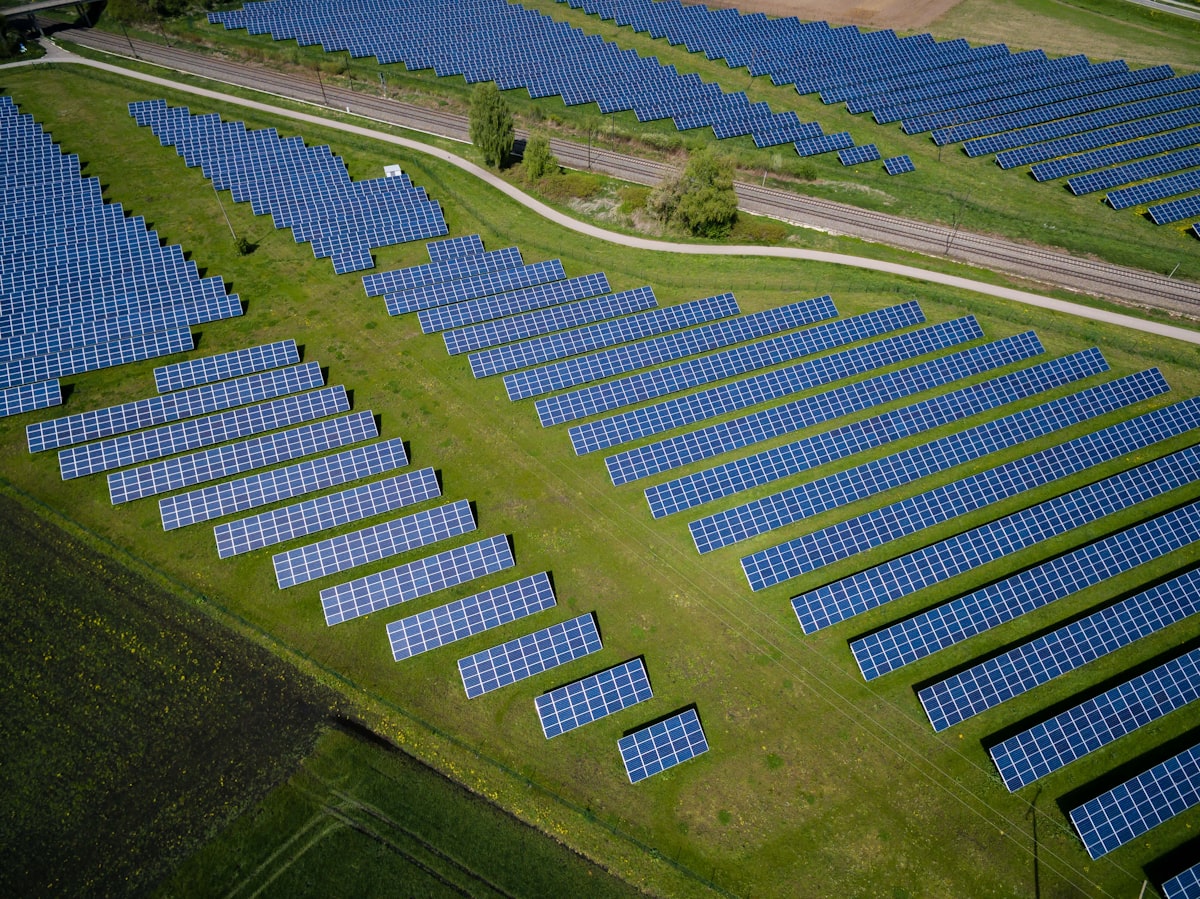
Plant-level generation forecast.
A model specific to your organisation's solar, wind or hydro plant. For licensed plants, actual generation is taken from EPİAŞ; for unlicensed plants, the organisation uploads the generation history.
- 1
Application
A licensed plant is selected from the EPİAŞ catalogue; for an unlicensed plant, the location, installed capacity and generation history are submitted.
- 2
Approval
Our team reviews the application and the data; after commercial approval it moves on to setup.
- 3
Setup
The model is trained on historical generation data and backtested; the result is reported in the dashboard.
Active
A plant-specific 24-hour forecast is published every morning; accuracy is updated as actual generation arrives.
API integration.
All data in the dashboard is also available through the REST API; with a key it is transferred to ETRM, Excel or in-house models.
- Hourly series, latest publication, CSV export and accuracy endpoints
- Plant forecasts and generation data upload
- Read-only keys; account operations only through the dashboard
curl -H "X-Api-Key: mgw_…" \
  "https://api.megawattron.com/v1/forecasts/latest?product=demand&country=TR"
{
  "product": "demand",
  "country": "TR",
  "timezone": "Europe/Istanbul",
  "day": "2026-08-27",
  "rows": [
    { "localTime": "2026-08-27T00:00", "forecast": 31240.5 },    { "localTime": "2026-08-27T01:00", "forecast": 29810.0 },    { "localTime": "2026-08-27T02:00", "forecast": 28930.0 },    …    { "localTime": "2026-08-27T23:00", "forecast": 33180.0 }  ]
}
Organisations we serve.
Energy trading and supply companies
Demand and price forecasts for day-ahead and intraday position management; a direct data feed into portfolio management systems through the API, and project-based portfolio optimisation.
- Demand
- PTF
- API
- Portfolio optimisation
Plant owners and operators
Plant-specific hourly generation forecasts for solar, wind and hydro plants; more accurate production schedule (KGÜP) submissions and monitoring of imbalance cost.
- Plant forecast
- Solar · Wind
- CSV
Distribution companies and industrial sites
Demand forecasting at zone, substation or site level; operational planning and battery charge–discharge optimisation in local grids with distributed generation and storage.
- Demand forecast
- Grid
- Battery
Industrial sites with self-consumption
For sites that sell their surplus electricity: their own generation forecast alongside national demand and price forecasts in the same dashboard; internal sharing through the email report.
- Plant forecast
- PTF
- Email report
Demo account and subscription.
Next-day forecasts are published every morning at 10:15. Demo accounts for evaluation are opened by our team; for plan purchases, the subscription is activated the same day once the bank transfer has been confirmed.
Sign-up → plan selection → bank transfer (reference code) → active the same day